Emil W. Ciurczak, DoraMaxx Consulting06.06.17
Several of my recent columns have covered a number of new(er) technologies for process control, specifically to modernize contract manufacturing organizations (CMO) and contract research organizations (CROs). But these technologies were almost entirely applicable to solid dosage forms. The flip side of solid dosage form pharmaceuticals is biopharmaceuticals. The largest difference is that solid forms need to have powders, pastes, and tablets monitored. Biopharma does most of its real work in aqueous solutions/suspensions.
The active pharmaceutical ingredient (API) in a tablet or capsule is synthesized like any other fine chemical. It is seldom any longer made where the final product is put together and most likely synthesized by a group of synthetic organic chemists. This process is usually optimized before the final product has sold one unit. The art and, therefore, the gauntlet of problems is making the delivery unit, a.k.a., the tablet, or capsule. The physical operations of weighing, mixing, wetting/drying to form granules, tableting or encapsulating, and coating are just that, physical operations, not chemical operations.
In the biopharmaceutical industry, the complex processes are the (bio)chemical generation of the organic chemicals—proteins, antibiotics, enzymes—not the packaging of the drugs. These operations take place in complex solutions and are often multi-step reactions, followed by a multi-step cleaning/purification process. And, while both industries are in the business of healthcare, there are significant differences.
The staff of both types of companies are somewhat different. In small molecule manufacturing, there are organic and analytical chemists (both R&D and QC), engineers, and pharmacists. The R&D and QC labs have been using spectroscopy, chromatography, and a host of other instruments for many decades. Hence, the principles of PAT and QbD were only mildly new: move the tools into the production facility. All that was needed to succeed was a financial impetus to begin.
In the manufacture of biomolecules, usually there are mostly biochemists involved at every step. Therefore, the scientists who developed the molecules are pretty much the same as those who produce them and the ones who analyze them. There is less variety of disciplines, hence, less exposure to spectroscopic and other analytical techniques. As a consequence, many of the newer technologies had few champions inside the industry. And, since many of the newer companies weren’t profitable for many years, extra spending wasn’t in the cards.
(Tine-Resolved) Raman Spectroscopy
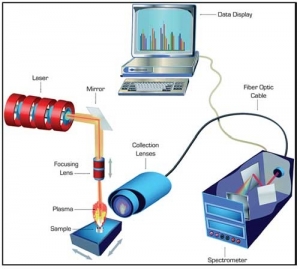
Since Raman is virtually impervious to water (very, very weak absorbencies, therefore, invisible, for all intents and purposes), it is an excellent technology to follow/control fermenters. Mid-range Infrared and even Near-Infrared spectroscopies have huge water bands and are limited in their usefulness for biopharma production—MIR loses all its energy and NIR bands are quite non-specific. Raman spectra not only are water-resistant, but have sharp, specific peaks, resembling MIR spectra. This versatility and specificity, coupled with advances in LASER technology, optics, and software capabilities explains the large number of Raman applications reported every year.
There is one minor problem with Raman, of course. Often the background fluorescence is orders of magnitude more intense than the useful spectra. This massive background reduces the clear, specific Raman spectral peaks to small bumps on a large mound. This fluorescence may be reduced by increasing the incident wavelength of the LASER used. The strongest Raman and, unfortunately, fluorescence signals occur with visible excitation. As the wavelength of the LASER is lengthened into the NIR (over 1000 nm), the fluorescence becomes almost negligent.
Unfortunately, the Raman intensity is inversely proportional to the fourth power of the wavelength. Thus, as the background slowly diminishes, the signal quickly diminishes, making interpretation difficult.
Since real-time analysis of bioprocesses would be a massive benefit for the industry, a reliable Raman analyzer would be a beneficial tool in the solution. A relatively new company named TimeGate produces an instrument that electronically samples the signal arising from a sample after it has been flashed with a short LASER pulse. It uses a picosecond (ps) pulsed LASER source with microchip-based MOPA (master oscillator power amplifier). It has a spectral line width < 0.1 nm and a pulse width < 100 ps. Its repetition rate is 40-50 kHz with an average output power 20-40 mW. The first few nanoseconds (ns) are captured, then the door is electronically slammed shut to keep fluorescence out. The resultant spectrum is far cleaner than traditional spectrum, overlain on the fluorescence background.
This versatile unit can then be run at wavelengths from 525 through the SW-NIR, allowing for optimization of excitation energies for each particular analyte. A good biopharma example would be the ability to determine the constituents in both cells and the surrounding matrix (supernatant). Using the narrow beam LASER, it is relatively simple to scan the reactor contents, striking both biomass and solvent (solution), sequentially.
Electrical Resistance Tomography (ERT)
I have written about this technique for disparate small molecule applications, such as dissolution testing and blending a liquid throughout a powder matrix. As another technique where water is not a problem, it might well be used to follow dispersion of nutrients and levels of solids within a stirred matrix.
The technique is capable of visualizing a process’ relative conductivity distribution within the sensor. Generally, an ERT system contains a data acquisition instrument, a sensor, and tomography reconstruction software.
In the typical electronic response, the conductance/capacitance of a system varies. These differences are monitored by the sensors along the walls of the container. The software then displays the measurements as a map of different densities. In a fermenter, this would show the growth patterns, allowing for a measure of how much biomass exists and how it is distributed throughout the tank.
Spectroscopic methods are localized and, while accurate and precise, only show the chemistry over a compact area, unless multiple locations scanned and/or long exposures taken. Sampling methods, both manual and automated, only show the composition at the point of sampling. The information provided by ERT allows the analyst to simultaneously sample at representative times and locations. Furthermore, the mixing parameters may also be adjusted inreal time to give a more homogeneous mixture, assuring proper mounts of nutrients to all biological entities within the tank.
LASER-Induced Fluorescence (LIF)
Used for applications such as blend uniformity in solid/powder samples, it now exists for liquid environments (i.e., cleanliness of containers and sterility of water) since LIF may be used as a bioburden measurement technique. Microorganisms use metabolites (e.g., NADH, riboflavin) to regulate their growth and development. These metabolites have intrinsic fluorescence emissions when exposed to properly selected wavelengths. LIF is a sensitive technique that uses this fact to detect microbes. Advances in the technology allows it to be used to measure microbial levels in water.
A sample stream from the bulk reactor is diverted to the analyzer flow cell. The 405 nm LASER penetrates the sample and induces fluorescence in the metabolites (present in the microbes). The resulting emitted fluorescence is collected via a photomultiplier tube. The concentration of particles in the water is determined by a second sensor via Mie scatter¬ing. Data from the two detectors is correlated using proprietary algorithms.
While most inert materials do not fluoresce, some do, including certain polymers. Therefore, there is a risk that inert particles might be counted as biological. However, by analyzing both the emitted fluorescence and the scattered light, the software is able to accurately distinguish microbes from non-microbial particles. This instrument can save days, waiting for contamination results via traditional methodology.
While the technologies mentioned in this piece are far from ubiquitous, or inexpensive, they are very nice tools in the measurement suite and often give numbers/measurements that are either not seen today or taken at a “sample-and-send-to-lab-and-wait” pace.
Emil W. Ciurczak
DoraMaxx Consulting
Emil W. Ciurczak has worked in the pharmaceutical industry since 1970 for companies that include Ciba-Geigy, Sandoz, Berlex, Merck, and Purdue Pharma, where he specialized in performing method development on most types of analytical equipment. In 1983, he introduced NIR spectroscopy to pharmaceutical applications, and is generally credited as one of the first to use process analytical technologies (PAT) in drug manufacturing and development.
The active pharmaceutical ingredient (API) in a tablet or capsule is synthesized like any other fine chemical. It is seldom any longer made where the final product is put together and most likely synthesized by a group of synthetic organic chemists. This process is usually optimized before the final product has sold one unit. The art and, therefore, the gauntlet of problems is making the delivery unit, a.k.a., the tablet, or capsule. The physical operations of weighing, mixing, wetting/drying to form granules, tableting or encapsulating, and coating are just that, physical operations, not chemical operations.
In the biopharmaceutical industry, the complex processes are the (bio)chemical generation of the organic chemicals—proteins, antibiotics, enzymes—not the packaging of the drugs. These operations take place in complex solutions and are often multi-step reactions, followed by a multi-step cleaning/purification process. And, while both industries are in the business of healthcare, there are significant differences.
The staff of both types of companies are somewhat different. In small molecule manufacturing, there are organic and analytical chemists (both R&D and QC), engineers, and pharmacists. The R&D and QC labs have been using spectroscopy, chromatography, and a host of other instruments for many decades. Hence, the principles of PAT and QbD were only mildly new: move the tools into the production facility. All that was needed to succeed was a financial impetus to begin.
In the manufacture of biomolecules, usually there are mostly biochemists involved at every step. Therefore, the scientists who developed the molecules are pretty much the same as those who produce them and the ones who analyze them. There is less variety of disciplines, hence, less exposure to spectroscopic and other analytical techniques. As a consequence, many of the newer technologies had few champions inside the industry. And, since many of the newer companies weren’t profitable for many years, extra spending wasn’t in the cards.
(Tine-Resolved) Raman Spectroscopy
Since Raman is virtually impervious to water (very, very weak absorbencies, therefore, invisible, for all intents and purposes), it is an excellent technology to follow/control fermenters. Mid-range Infrared and even Near-Infrared spectroscopies have huge water bands and are limited in their usefulness for biopharma production—MIR loses all its energy and NIR bands are quite non-specific. Raman spectra not only are water-resistant, but have sharp, specific peaks, resembling MIR spectra. This versatility and specificity, coupled with advances in LASER technology, optics, and software capabilities explains the large number of Raman applications reported every year.
There is one minor problem with Raman, of course. Often the background fluorescence is orders of magnitude more intense than the useful spectra. This massive background reduces the clear, specific Raman spectral peaks to small bumps on a large mound. This fluorescence may be reduced by increasing the incident wavelength of the LASER used. The strongest Raman and, unfortunately, fluorescence signals occur with visible excitation. As the wavelength of the LASER is lengthened into the NIR (over 1000 nm), the fluorescence becomes almost negligent.
Unfortunately, the Raman intensity is inversely proportional to the fourth power of the wavelength. Thus, as the background slowly diminishes, the signal quickly diminishes, making interpretation difficult.
Since real-time analysis of bioprocesses would be a massive benefit for the industry, a reliable Raman analyzer would be a beneficial tool in the solution. A relatively new company named TimeGate produces an instrument that electronically samples the signal arising from a sample after it has been flashed with a short LASER pulse. It uses a picosecond (ps) pulsed LASER source with microchip-based MOPA (master oscillator power amplifier). It has a spectral line width < 0.1 nm and a pulse width < 100 ps. Its repetition rate is 40-50 kHz with an average output power 20-40 mW. The first few nanoseconds (ns) are captured, then the door is electronically slammed shut to keep fluorescence out. The resultant spectrum is far cleaner than traditional spectrum, overlain on the fluorescence background.
This versatile unit can then be run at wavelengths from 525 through the SW-NIR, allowing for optimization of excitation energies for each particular analyte. A good biopharma example would be the ability to determine the constituents in both cells and the surrounding matrix (supernatant). Using the narrow beam LASER, it is relatively simple to scan the reactor contents, striking both biomass and solvent (solution), sequentially.
Electrical Resistance Tomography (ERT)
I have written about this technique for disparate small molecule applications, such as dissolution testing and blending a liquid throughout a powder matrix. As another technique where water is not a problem, it might well be used to follow dispersion of nutrients and levels of solids within a stirred matrix.
The technique is capable of visualizing a process’ relative conductivity distribution within the sensor. Generally, an ERT system contains a data acquisition instrument, a sensor, and tomography reconstruction software.
In the typical electronic response, the conductance/capacitance of a system varies. These differences are monitored by the sensors along the walls of the container. The software then displays the measurements as a map of different densities. In a fermenter, this would show the growth patterns, allowing for a measure of how much biomass exists and how it is distributed throughout the tank.
Spectroscopic methods are localized and, while accurate and precise, only show the chemistry over a compact area, unless multiple locations scanned and/or long exposures taken. Sampling methods, both manual and automated, only show the composition at the point of sampling. The information provided by ERT allows the analyst to simultaneously sample at representative times and locations. Furthermore, the mixing parameters may also be adjusted inreal time to give a more homogeneous mixture, assuring proper mounts of nutrients to all biological entities within the tank.
LASER-Induced Fluorescence (LIF)
Used for applications such as blend uniformity in solid/powder samples, it now exists for liquid environments (i.e., cleanliness of containers and sterility of water) since LIF may be used as a bioburden measurement technique. Microorganisms use metabolites (e.g., NADH, riboflavin) to regulate their growth and development. These metabolites have intrinsic fluorescence emissions when exposed to properly selected wavelengths. LIF is a sensitive technique that uses this fact to detect microbes. Advances in the technology allows it to be used to measure microbial levels in water.
A sample stream from the bulk reactor is diverted to the analyzer flow cell. The 405 nm LASER penetrates the sample and induces fluorescence in the metabolites (present in the microbes). The resulting emitted fluorescence is collected via a photomultiplier tube. The concentration of particles in the water is determined by a second sensor via Mie scatter¬ing. Data from the two detectors is correlated using proprietary algorithms.
While most inert materials do not fluoresce, some do, including certain polymers. Therefore, there is a risk that inert particles might be counted as biological. However, by analyzing both the emitted fluorescence and the scattered light, the software is able to accurately distinguish microbes from non-microbial particles. This instrument can save days, waiting for contamination results via traditional methodology.
While the technologies mentioned in this piece are far from ubiquitous, or inexpensive, they are very nice tools in the measurement suite and often give numbers/measurements that are either not seen today or taken at a “sample-and-send-to-lab-and-wait” pace.
Emil W. Ciurczak
DoraMaxx Consulting
Emil W. Ciurczak has worked in the pharmaceutical industry since 1970 for companies that include Ciba-Geigy, Sandoz, Berlex, Merck, and Purdue Pharma, where he specialized in performing method development on most types of analytical equipment. In 1983, he introduced NIR spectroscopy to pharmaceutical applications, and is generally credited as one of the first to use process analytical technologies (PAT) in drug manufacturing and development.